What PageSpeed Insights Measures
PageSpeed Insights reports two types of data. Field data (also called Chrome User Experience Report data) comes from real users who visited your page using Chrome. It reflects actual load times under real-world conditions — different devices, connection speeds, and locations. This is the data Google uses for ranking. If your site doesn’t have enough traffic to generate field data, this section will be empty or show limited data. Lab data comes from a simulated load run in a controlled environment using Lighthouse. It’s consistent and reproducible, which makes it useful for tracking improvements over time. Lab data is what produces your overall performance score. The performance score runs from 0 to 100. Scores of 90 and above are considered good. 50 to 89 is in the needs improvement range. Below 50 is poor. Mobile and desktop are scored separately, and mobile is almost always lower — which matters because Google uses mobile-first indexing.Core Web Vitals Explained
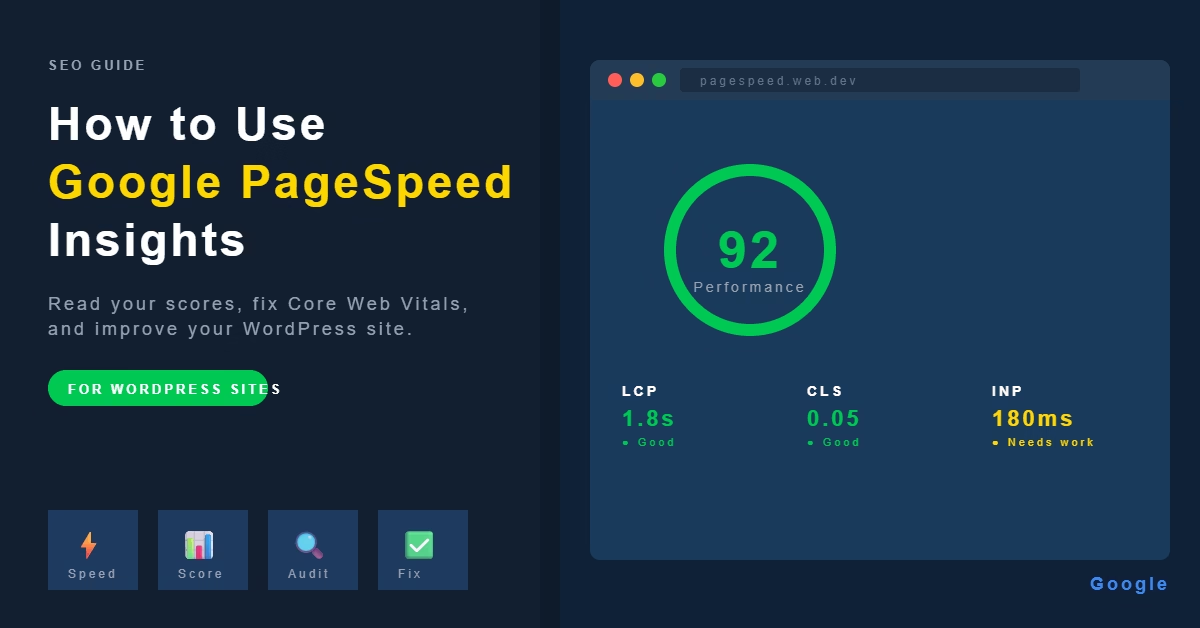
Core Web Vitals are three specific metrics that Google treats as quality signals. PageSpeed Insights displays them prominently and flags whether each one passes or fails. Largest Contentful Paint (LCP) measures how long it takes for the largest visible element on the page — usually a hero image or large heading — to load. A good LCP is under 2.5 seconds. This is typically the hardest metric to pass on image-heavy pages. Cumulative Layout Shift (CLS) measures visual stability — how much the page jumps around as it loads. A good CLS score is under 0.1. Common causes on WordPress sites include images without set dimensions, late-loading fonts, and banner ads. Interaction to Next Paint (INP) measures how quickly the page responds when a user clicks or taps something. A good INP is under 200 milliseconds. Heavy JavaScript is usually the culprit when this fails. If field data is available, you’ll see each metric with a pass or fail status. If you’re working from lab data only, the equivalent metrics are FCP (First Contentful Paint) and TBT (Total Blocking Time), which serve as proxies.How to Run a PageSpeed Insights Test
Go to Google PageSpeed Insights, enter your URL, and click Analyse. Wait for the report to load — it typically takes 15 to 30 seconds. Run the test on your homepage, but also on a representative blog post or page. Performance often varies significantly between page types. A heavy WooCommerce product page may score very differently from a simple text post. Run separate tests for mobile and desktop using the toggle at the top of the results. Always check mobile first, since that’s what Google prioritises.Reading the Diagnostics Section
Below your scores and Core Web Vitals, PageSpeed Insights lists specific opportunities and diagnostics. This is where the actionable information lives. Opportunities are issues with an estimated time saving attached. These are prioritised fixes. Common ones on WordPress sites include:- Eliminate render-blocking resources — usually CSS or JavaScript loading before the page is visible
- Properly size images — images larger than they need to be at their display size
- Serve images in next-gen formats — flagging JPEG and PNG files that could be WebP or AVIF
- Reduce unused JavaScript — scripts loaded but not needed on that specific page
- Enable text compression — pages not using gzip or Brotli compression
Fixing Common Issues in WordPress
You don’t need to address every item in the report. Focus on the opportunities with the largest estimated savings first. Render-blocking resources are usually handled by your caching or performance plugin. LiteSpeed Cache, for example, has settings for CSS and JavaScript optimisation — combining files, deferring scripts, and inlining critical CSS. Enable these carefully, as aggressive settings can break page layouts. Test after each change. Image issues — oversized images, wrong formats, missing dimensions — are among the most common findings on WordPress sites. When you upload images, resize them to roughly the display size before uploading. Use a plugin or your theme’s built-in handling to serve WebP versions automatically. Always set explicit width and height attributes on images to prevent layout shift. Unused JavaScript is often tied to plugins. If a plugin loads scripts site-wide but only needs them on specific pages, look for a setting to limit where it runs, or consider whether the plugin is necessary at all. Server response time (flagged as “Reduce initial server response time”) is a hosting issue. If your TTFB (Time to First Byte) is consistently slow, your host’s server performance is the limiting factor — no amount of plugin optimisation fully compensates for a slow server. For a full walkthrough of WordPress speed improvements you can make alongside these fixes, see How to Improve WordPress Speed and Mobile Performance for a New Website.Tracking Changes Over Time
PageSpeed Insights scores fluctuate between tests, sometimes by 5 to 10 points, due to variability in the test environment. Don’t read too much into small changes from a single test. Instead, run three tests in a row and take the average, or use Google Search Console’s Core Web Vitals report for field data trends over time. When you make a significant change — installing a new plugin, switching themes, adding a page builder — run PageSpeed Insights before and after so you can see the actual impact.Common Mistakes
Chasing a score of 100 is rarely worth the effort. The difference between an 80 and a 100 is often marginal for real users. Focus on passing Core Web Vitals and addressing the highest-impact opportunities. Testing only on desktop misses the point. Google uses mobile-first indexing, so your mobile score is what matters for search. Many WordPress sites score well on desktop and poorly on mobile due to unoptimised images and heavy scripts. Making multiple changes at once makes it impossible to know what helped. Make one change, test, then proceed.When to Look Beyond PageSpeed Insights
PageSpeed Insights is a useful starting point, but it tests one page at a time in a simulated environment. For a broader picture, Google Search Console’s Core Web Vitals report shows field data across your whole site broken down by URL group. This is more reliable for understanding whether your improvements are having real-world impact. If your scores are consistently low despite following the standard fixes, the issue is likely your hosting environment or theme. A lightweight theme and a good managed WordPress host make far more difference to baseline performance than any plugin combination.Once PageSpeed Insights highlights your weak spots, improving those scores comes down to addressing LCP, CLS, and INP directly. The guide on how to improve Core Web Vitals in WordPress covers each metric with specific fixes you can apply without a developer.
One of the most common warnings PageSpeed Insights flags is render-blocking resources — scripts and stylesheets that delay the first paint. If that’s showing up in your results, removing render-blocking resources in WordPress walks through exactly how to fix it using JavaScript deferral and critical CSS extraction.
Conclusion
Run PageSpeed Insights on your homepage and a representative post, prioritise the opportunities with the largest savings, and check your Core Web Vitals status. Fix the top two or three issues, then re-test. Repeat this process after any significant site change, and check Google Search Console periodically to track real-world performance trends. For a broader approach to the underlying performance issues PageSpeed surfaces, the guide on improving WordPress speed and mobile performance covers caching, image optimisation, and the other practical steps in full.
Etienne Basson works with website systems, SEO-driven site architecture, and technical implementation. He writes practical guides on building, structuring, and optimizing websites for long-term growth.